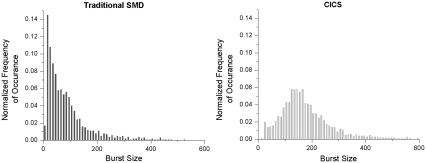
FIGURE 6.
Burst size distribution analysis histograms of PicoGreen-stained pBR322 DNA taken using standard SMD (left) and CICS (right). In standard SMD, the DNA peak is not resolved from the noise fluctuations due to the Gaussian OV profile whereas CICS shows a clearly discernible peak due to the high uniformity of the OV profile.

