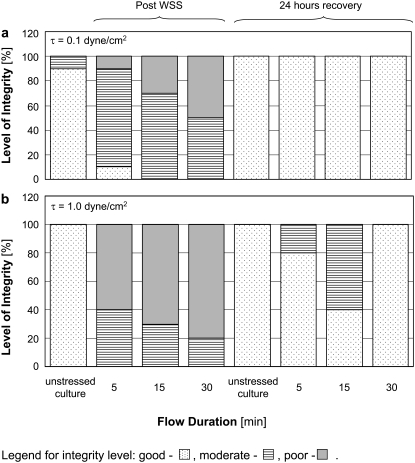
FIGURE 7.
Level of integrity of β-tubulin fibers in cultures exposed to (a) 0.1 dyne/cm2 and (b) 1.0 dyne/cm2. The results are from a representative experiment and show the same trends as the two other experiments. Dotted bars represent good integrity, horizontal lines bars represent moderate integrity, and gray bars represent poor integrity.

