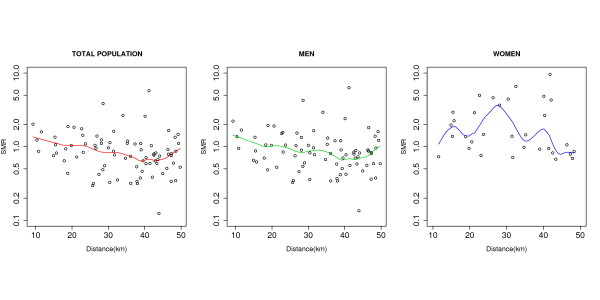
Figure 3.
Towns of < 10,000 inhabitants situated less than 50 km from industry 2761: standardised mortality ratio (SMR) and distance to industry. Towns with SMR = 0 eliminated to enable gradient in women to be more clearly observed. Semilogarithmic scale. Graph shows total population (82 towns) at left, men (79 towns) in the centre, and women (32 towns) at right. Local weighted scatterplot smoothing (lowess) techniques were applied for plotting the line of trend using a span of 0.3.

