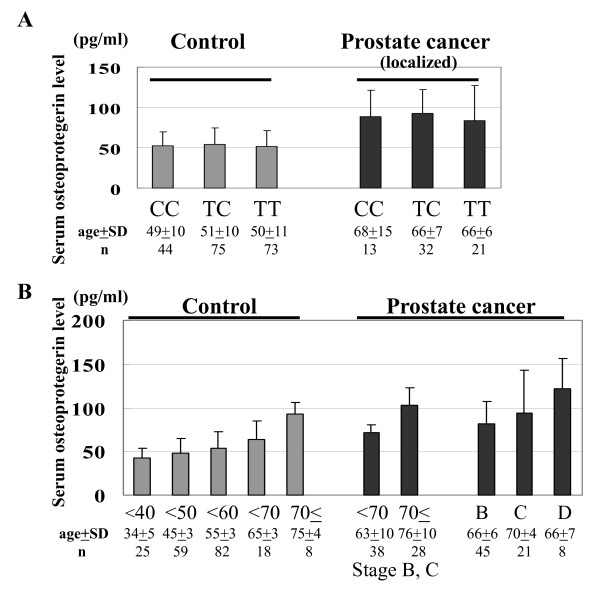
Figure 2.
The serum OPG levels in healthy controls and patients with PCa. (A) Comparison of the serum OPG levels and the 950 T/C genotype in 192 healthy controls and 66 localized PCa patients. (B) Comparison of the serum OPG level by age and disease status (stage B, C, and D) in healthy controls and patients with PCa. *Age represents mean ± standard deviation.

