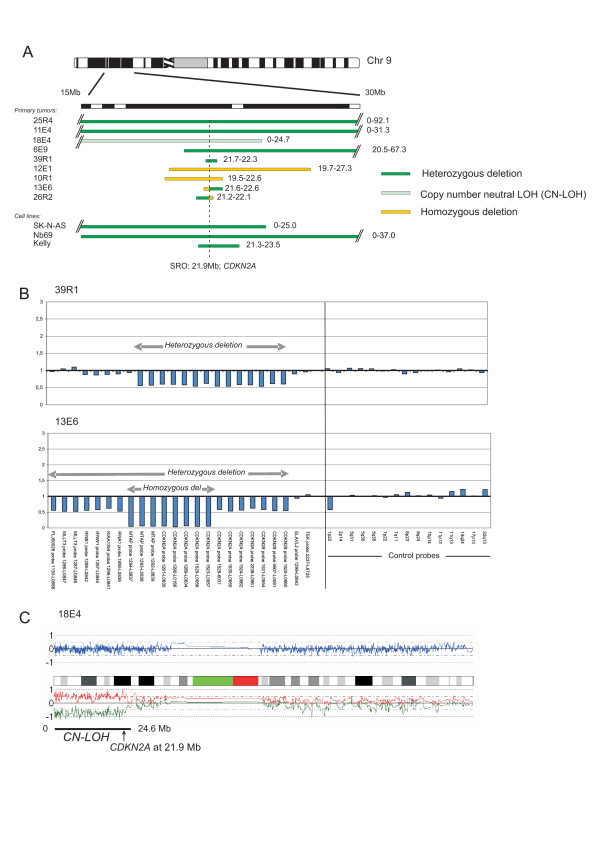
Figure 4.
Deletions of chromosome 9p. (A) Array-copy number analyses of chromosome 9 deletions. Green bars illustrate heterozygous deletions, yellow bars homozygous deletions and light green CN-LOH. (B) Example of the MLPA analysis of the CDKN2A/B region. The SRO of deletions resides in the gene CDKN2A. (C) CN-LOH of 9p in tumor 18E4.

