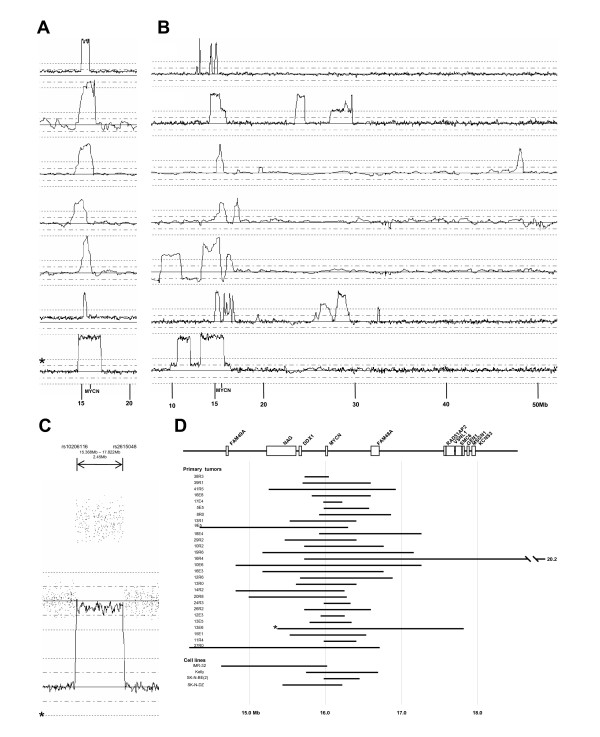
Figure 5.
Amplification of MYCN. (A) Representative tumors with simple continuous amplicons amplified. (B) Tumors with complex rearrangements. (C) The sample marked with an asterisk from the A panel in more detail. The figure shows how precisely the amplification borders can be defined using this technique. (D) The common region of amplification in tumors and cell lines. No genes other than MYCN were found in all cases with amplification.

