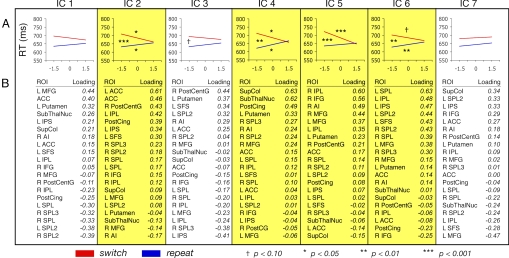
Fig. 3.
Components extracted from ICA, with ICs predicting cognitive flexibility highlighted. (A) Mean regression lines for switch and repeat conditions. Symbols above switch line and below repeat line denote significance of difference between slope value versus an hypothesized mean of 0. Symbols between switch and repeat lines denote significance of difference between the 2 slopes. (B) Summary of the ROIs' factor loadings.

