Fig. 1.
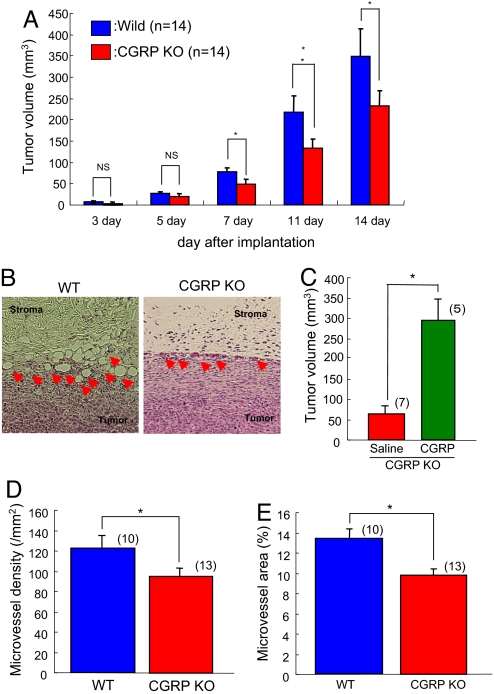
Reduced tumor-associated angiogenesis and tumor growth in CGRP-knockout (KO) mice. (A) Tumor growth after implantation in CGRP-knockout mice and their WT counterparts. LLC cells were implanted s.c. Results were compared with growth in WT counterparts on the same day and are mean ± SEM from 14 animals. ANOVA was used. *, P < 0.05. NS, not significant. (B) Typical H&E staining of tumors (day 14) in CGRP-KO mice (Left) and their WT counterparts (Right). Arrowheads indicate newly formed blood vessels. (C) Tumor growth in CGRP−/− infused with CGRP continuously (0.1 nmol/h) by using miniosmotic pumps. LLC cells were implanted s.c. to the site of CGRP infusion. Results were compared with growth in vehicles-infused CGRP−/− on day 7 and are mean ± SEM from 5∼7 animals. Student's t test was used. *, P < 0.05. (D) In the histologic tumor samples isolated from the mice 14 days after implantation, microvessel density was determined. Results from the sham operation group (blue column) were compared with those of denervation (red column) and are mean ± SEM from 10∼13 animals. Student's t test was used. *, P < 0.05. (E) Microvessel area was determined in the same specimen as in C. Results from the CGRP-KO mice (red column) were compared with those of WT (blue column) and are mean ± SEM from 10∼13 animals. Student's t test was used. *, P < 0.05.

