
Fig. 1.
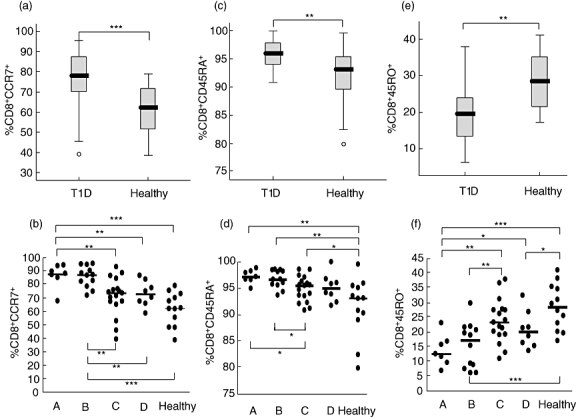
Expression of CCR7, CD45RA and CD45RO receptors on CD8+ cells was determined by flow cytometry. The percentages (%) of cells expressing each receptor in the diabetic (T1D) and healthy groups is shown in box-plots (a,c,e). Horizontal lines represent the median, the box comprises the 25th and 75th percentiles and the error bars the 10th and 90th percentiles. Outliers are indicated. CCR7 (b), CD45RA (d) and CD45RO (f) expression of the receptors on CD8+ cells in relation to duration of T1D in comparison with healthy controls is shown. Patients were grouped according to duration of disease: 0–4 months (A, n = 7); 5–9 months (B, n = 12); 10–14 months (C, n = 17) and 15–18 months (D, n = 8); healthy (n = 12). Asterisks indicate the level of significance: *P < 0·05; **P < 0·01, ***P < 0·001.