
Fig. 2.
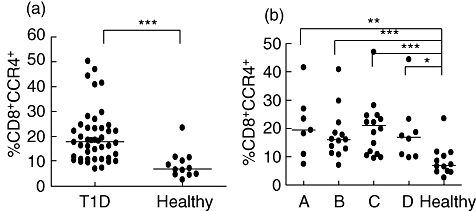
Expression of CCR4 receptors on CD8+ cells was determined by flow cytometry. The percentages (%) of cells expressing CCR4 is shown for each individual in the diabetic (T1D) and healthy groups (a). Patients were grouped according to duration of disease: 0–4 months (A, n = 7); 5–9 months (B, n = 12); 10–14 months (C, n = 17) and 15–18 months (D, n = 8); healthy (n = 12) (b). Horizontal lines represent the median and asterisks indicate the level of significance: *P < 0·05; **P < 0·01, ***P < 0·001.