
Fig. 4.
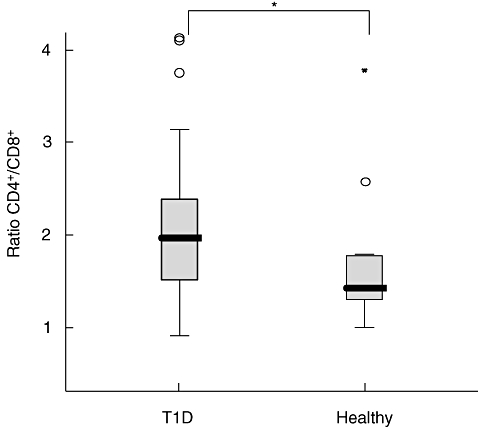
CD4+ and CD8+ cells were analysed by flow cytometry. The ratio of the percentages of CD4+/CD8+ was calculated for each individual. Horizontal lines represent the median, the box comprises the 25th and 75th percentiles and the error bars the 10th and 90th percentiles and outliers are indicated. Asterisk indicates the level of significance: *P < 0·05.