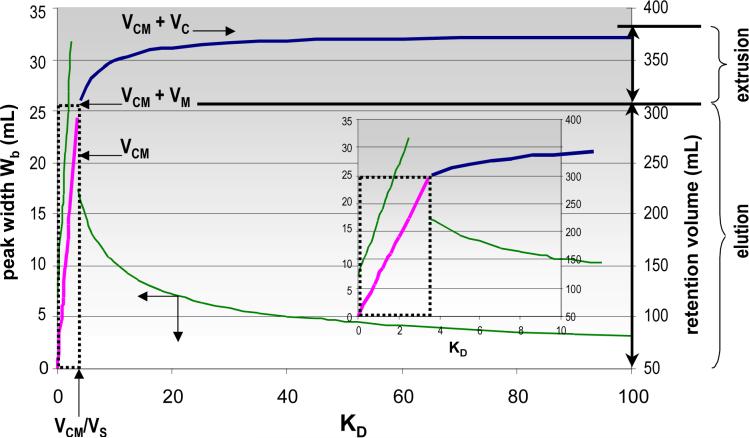
Figure 3.
Retention volume (right axis and thick lines) and solute peak width (in volume, left axis and thin lines) plotted versus solute distribution constant in the EECCC method. Values calculated (eq 1, 10 and 22) with VC = 120 mL, VM = 50 mL, VS = 70 mL, VCM = 254 mL and N = 900 plates. The limit between elution and extrusion occurs for KD = VCM/VS = 254/70 = 3.63 and VR = VCM + VM = 304 mL (dotted area). The inset is an enlargement of the 0<KD<10 region.

