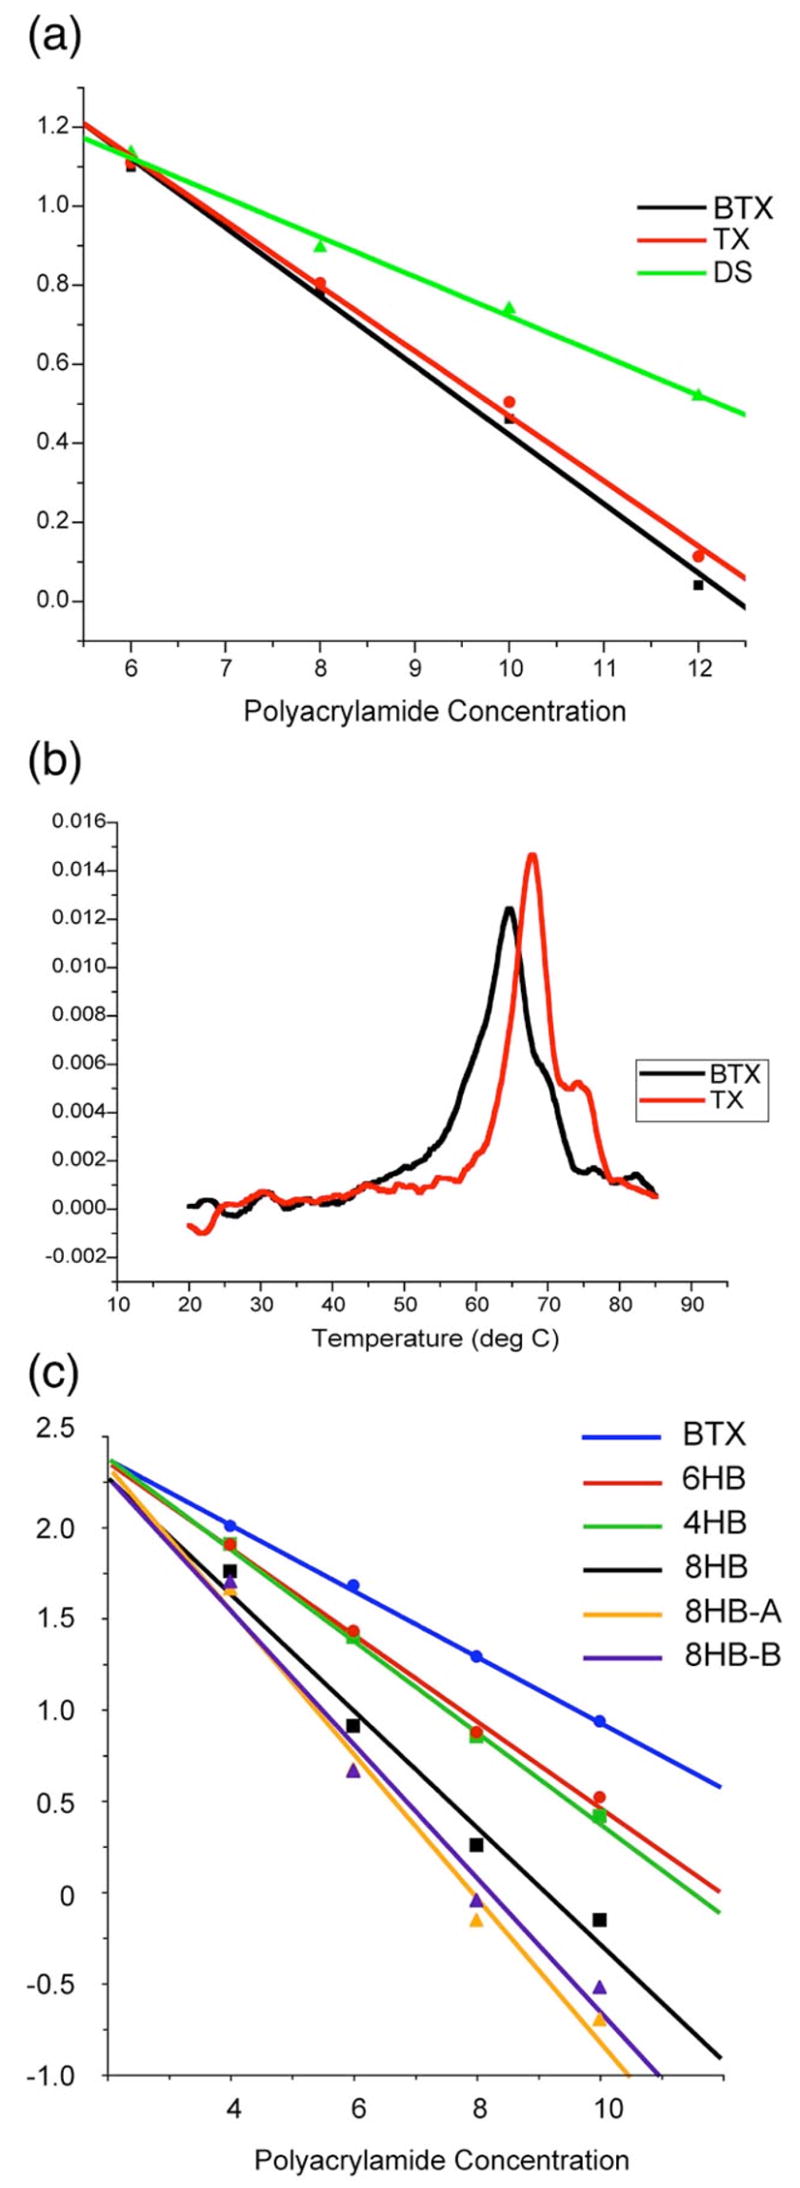
Figure 3.

Characterization of BTX and 4HB molecules. (a) Ferguson plots comparing BTX to a conventional planar TX molecule of the same length. A linear duplex molecule (slope = 0.100) is shown for comparison. The BTX molecule is similar, but its slope (0.175) is slightly higher than the planar molecule (0.165). (b) Differential melting plots of the BTX and TX molecules. Note that BTX melts at slightly lower temperatures. (c) Ferguson plots of the species used here. Slopes are BTX (0.180), 6HB (0.235), 4HB (0.251), 8HB (0.319), 8HB-A (0.396), 8HB-B (0.369).
