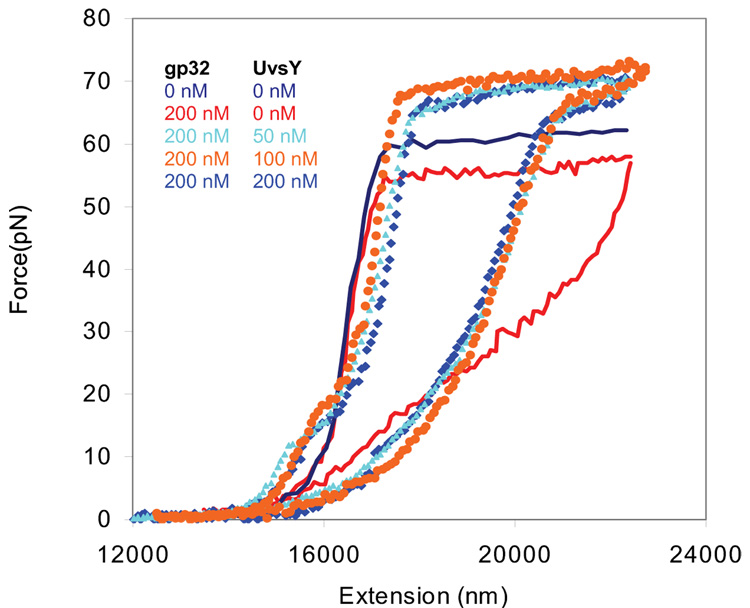
Fig. 6.
Stretching (solid line) and relaxation curves (symbols) for λ-DNA in 10 mM Hepes, pH 7.5, 50mM [Na+] (45 mM NaCl and 5 mM NaOH) in the absence of protein (dark blue) and in presence of 200 nM gp32 (red), 200 nM gp32 and 50nM UvsY (light blue), 200nM gp32 and 100nM UvsY( orange) and 200nM gp32 and 200nM UvsY (blue). The reproducibility of these measurements for individual stretching curves is similar to that obtained for the data in Fig. 3.

