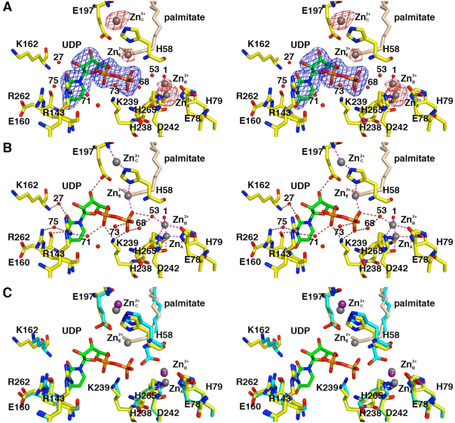
Figure 3.
LpxC-UDP complex (monomer A). (A) Omit electron density map contoured at 4σ (blue); Bijvoet difference Fourier map calculated with anomalous data collected at a wavelength corresponding to the zinc K-edge, contoured at 4σ (red). Atoms are color coded as follows: C = yellow, O = red, N = blue, P = orange; palmitate appears in light tan; zinc ions appear as dark gray spheres; water molecules appear as red spheres. Zinc occupancies are estimated as follows: Zn2+A′ 100%; Zn2+B′ 50%; Zn2+C′ 50%; Zn2+D′ 100% (not visible); Zn2+E′ 40%. (B) Intermolecular interactions in the LpxC-UDP complex. Dashed lines indicate zinc coordination (magenta) and hydrogen bond (brown) interactions. (C) Superposition with the zinc-inhibited structure of LpxC (19) (color coded as described above except that C = cyan and zinc ions appear as purple spheres) reveals minimal structural changes resulting from UDP binding.

