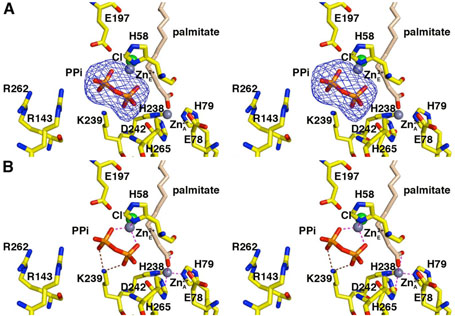
Figure 4.
LpxC–pyrophosphate complex (monomer A). (A) Omit electron density map contoured at 4σ; selected active site residues are indicated. Atoms are color coded as in Figure 3. Zinc occupancies are estimated as follows: Zn2+A′ 100%; Zn2+E′ 60%. (B) Intermolecular interactions in the LpxC-pyrophosphate complex. Dashed lines indicate zinc coordination (magenta) and hydrogen bond (brown) interactions.

