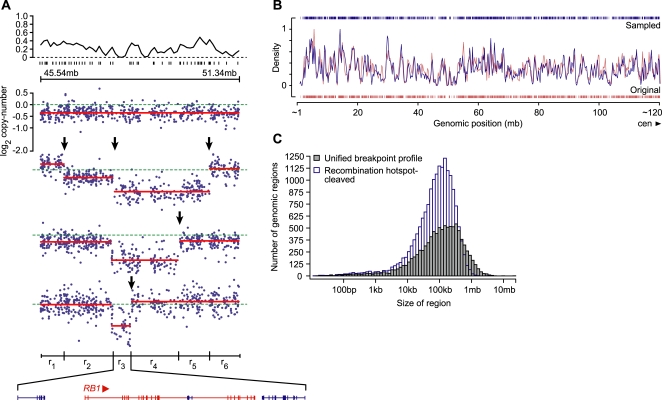
Figure 3. Aggregation and permutation.
(a) The density of human recombination hotspots (top; median distance between hotspots is ∼55 kb) spans segmentation (red) of probe-level data (dark blue) in a ∼5 mb region of 13q14.13-3 in four pleomorphic liposarcomas. The unique tumor-associated breakpoints (black arrows) define the UBP (regions r1–6; bottom), the smallest of which (r3) spans four genes including the tumor suppressor RB1 (direction of transcription indicated). (b) On chromosome 1p, the density distribution of predicted recombination hotspots (red) at a width equal to the median distance between all p-arm hotspots (56 kb), and the distribution of their randomization (blue). The sampling procedure respects the shape of the original distribution and therefore the sequence features that underlie it. (c) Size distribution of regions derived from segmentation and subsequently defined by the unified breakpoint profile (UBP; gray), and those hotspot-cleaved regions of the same permuted during null model generation (as indicated, blue).

