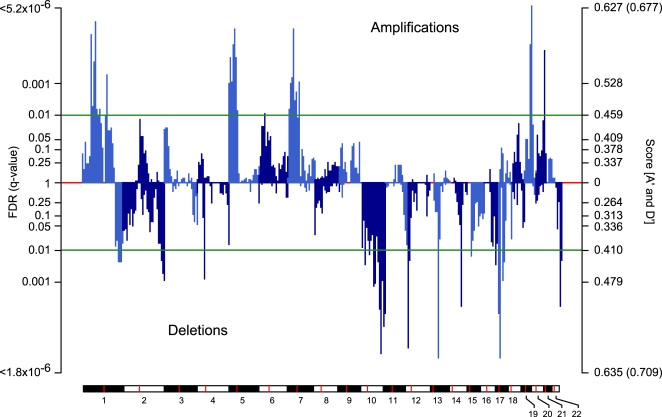
Figure 5. Statistically significant genomic alteration in pleomorphic liposarcoma.
The false discovery rate (q-value, left axis) and score (A′ and D′, right axis) for amplification and deletion (positive and negative respectively, labeled) on the 22 autosomes in genomic coordinates (chromosomes indicated at bottom and in plot by alternating colors, centromere in red). The threshold for significance determines the alterations subject to ROI detection (green). Maximum observed scores of A′ and D′ unattainable by permutation p-value (parentheses, right axis).

