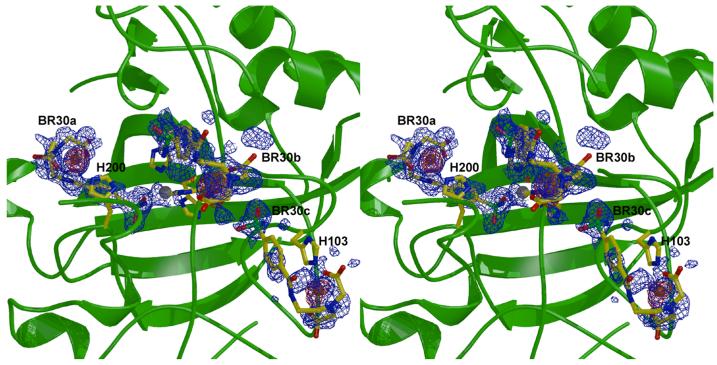
Figure 4.
Stereo figure illustrating CAI-BR30 interactions, including anomalous difference maps used for identifying copper ions (red, contoured at 3 σ) and simulated-annealing omit maps of ligands (blue, contoured at 2.5 σ). The inhibitor bound in the active site with ionized sulfonamide coordinated to Zn2+ is labeled “a” and the inhibitor bound in the second binding site is labeled “b”. Very weak electron density is also observed for a third inhibitor, “c”. Figure prepared with Bobscript and Raster3D.18

