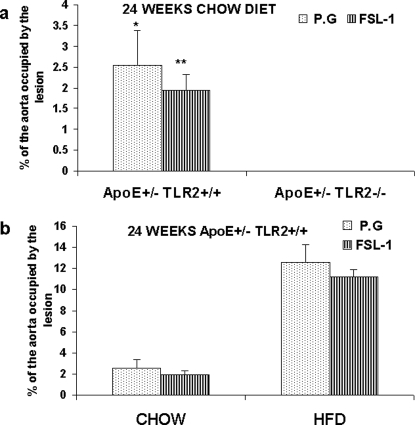
Figure 2. TLR2 activation through FSL-1 demonstrated no significant difference in aortic lesions when compared to P. g in ApoE+/−-TLR2+/+ and ApoE+/−-TLR2−/− mice.
(2A) Percentage of aortic surface area covered by lesions in chow-fed groups for mice from two genetic backgrounds (ApoE+/−-TLR2+/+ and ApoE+/−-TLR2−/−) injected with P. g or FSL-1 for 24 weeks. Values represent means±SD; *p<0.05 between ApoE+/−-TLR2+/+ mice and ApoE+/−-TLR2−/− mice injected with P. g; **p<0.05 between ApoE+/−-TLR2+/+ mice and ApoE+/−-TLR2−/− mice injected with FSL-1. No lesions were detected in ApoE+/−-TLR2−/− mice irrespective of the treatment. (2B) Percentage of aortic surface area covered by lesions in ApoE+/−-TLR2+/+ mice maintained on either diet and injected weekly with P. g or FSL-1 for 24 weeks. Values represent means±SD.

