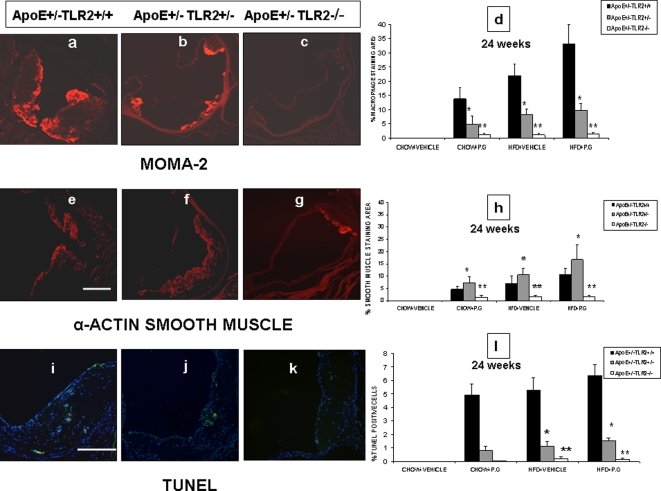
Figure 5. P. g and/or high fat diet results in unstable plaque in ApoE+/−-TLR2+/+ mice when compared to ApoE+/−-TLR2+/−, and ApoE+/−-TLR2−/− mice.
Representative photomicrographs of atherosclerotic plaques from the aortic sinus of ApoE+/−-TLR2+/+, ApoE+/−-TLR2+/− and ApoE+/-TLR2−/− mice maintained on a high fat diet and inoculated weekly with P. g (HP) for 24 weeks. Stains identify sections of macrophage infiltration (MOMA-2 red staining) (5a, 5b&5c); smooth muscle cells (α-SMA red staining) (5E, 5F&5G); TUNEL positive cells (green spots coinciding with nuclear stain DAPI) (5I, 5J&5K). Quantitative computer-assisted image analysis (as described in Materials and Methods) was used to quantify the percentage of macrophage-positive areas (5D), smooth muscle cell area (5H) and TUNEL/DAPI positive cells (5I) in proximal aortic lesions in ApoE+/−-TLR2+/+, ApoE+/−-TLR2+/− and ApoE+/-TLR2−/− mice of all the groups at the conclusion of the 24 week treatment period. Data represent means±SD; *p<0.05 for ApoE+/−-TLR2+/+ mice compared to ApoE+/−-TLR2+/− mice, and **p<0.05 for ApoE+/−-TLR2+/+mice compared to ApoE+/−-TLR2−/− mice in the same treatment condition and maintained on the same diet. Abbreviations are as defined in text. Original magnifications 100× for macrophages and smooth muscle and 200× for TUNEL/DAPI staining. Scale bar represents 0.5 mm.

