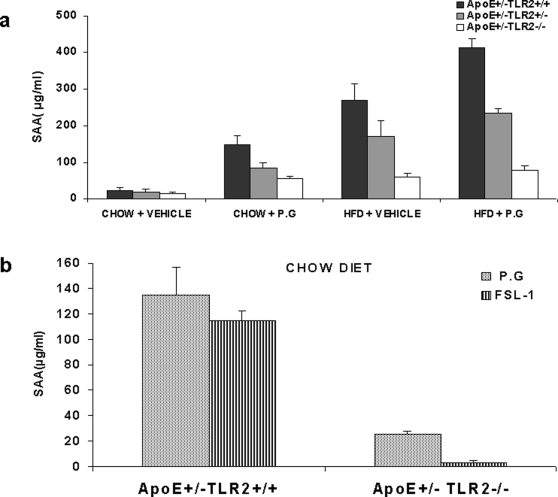
Figure 6. TLR2 activation through FSL-1 demonstrated no significant difference in SAA levels when compared to P. g in ApoE+/−-TLR2+/+ and ApoE+/−-TLR2−/− mice.
(6A) SAA levels in serum samples obtained after 24 weeks of inoculations, as determined by ELISA. Data represent means±SD; *p<0.05 between ApoE+/−-TLR2+/+mice and ApoE+/−-TLR2+/− mice; **p<0.05 between ApoE+/−-TLR2+/+mice and ApoE+/−-TLR2−/− mice maintained under the same conditions and on the same diet. Abbreviations are as defined in the text. (6B) SAA levels in serum samples obtained at the end of the study, determined by ELISA. Data represent means±SD in ApoE+/−-TLR2+/+ mice maintained on either standard chow or a high fat diet, and injected weekly with P. g or FSL-1.

