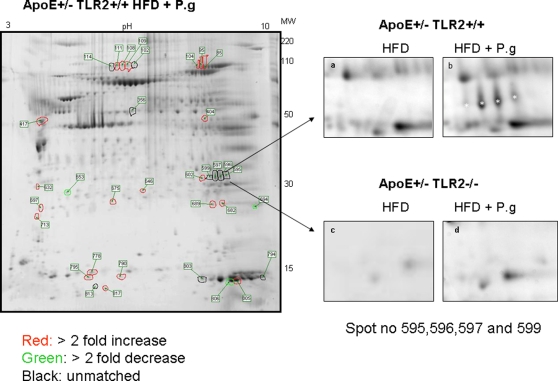
Figure 8. P.g and/or high fat diet demonstrated changes in the aortic protein in ApoE+/−-TLR2+/+ mice when compared to ApoE+/−-TLR2−/− mice.
Two-dimensional electrophoresis gel image of the proteins extracted from aortas (n = 5) from ApoE+/−-TLR2+/+ mice fed a high fat diet and injected weekly with P. g. Enlarged spots representing Hb were observed in aortas proteins from ApoE+/−-TLR2+/+ mice maintained on a high fat diet and injected with P. g (8B). Corresponding gel regions from aorta proteins from ApoE+/−-TLR2+/+ mice maintained on a high fat diet alone (8A) or ApoE+/−-TLR2−/− mice fed a high fat diet alone (8C) or also injected with P.g. (8D) did not exhibit the spots. Gels were stained by SYPRO RUBY stain. The spot numbers correspond to proteins listed in Table 1.

