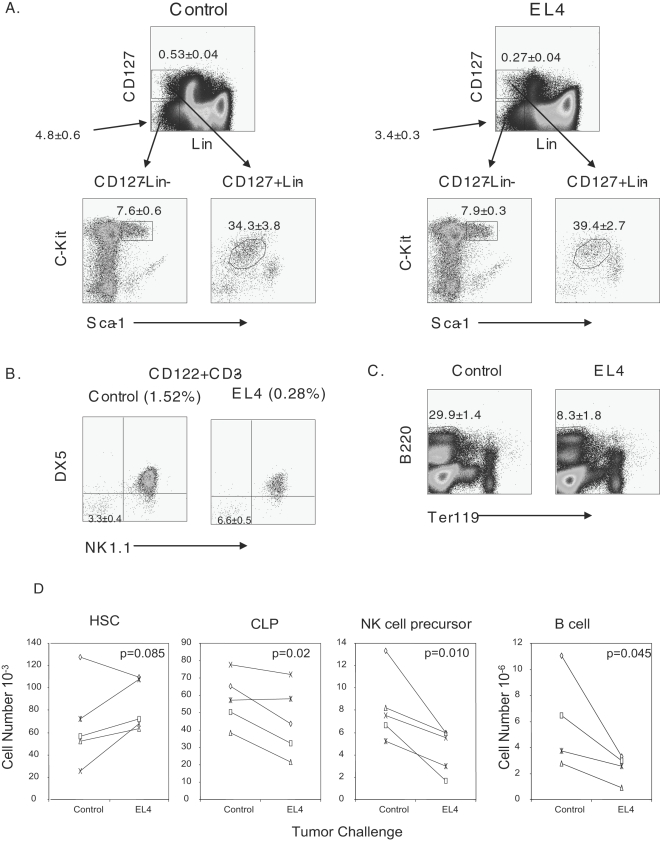
Figure 5. Altered lymphopoiesis.
B6 mice were injected with PBS or EL4 and sacrificed after 21 days. A. FACs profile of early hematopoiesis. HSCs are characterized as Lin−CD127−Sca1+cKit+ while the CLP is characterized as Lin-CD127+Sca1+cKit+. B. Characterization of NKPs as CD3−CD122+NK1.1−DX5−. C. Characterization of B cells by B220. D. Absolute numbers of HSCs, CLPs, NKPs, and B cells. Each line and symbol represents the mean of separate experiments involving 5 mice per group. A paired T test (one-tail) was used to determine whether tumor growth reduced the number of HSC, CLP, NKP and B cells. FACS data shown in A–C are representative of those obtained from 5 independent experiments, involving a total of 5 mice per group.

