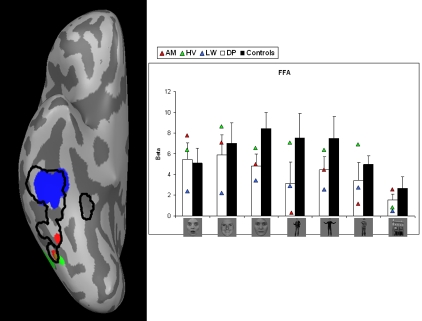
Figure 2. Face-specific activation in right FG when comparing faces (fearful/happy/neutral) with houses.
Left: Areas are shown on an inflated right hemisphere. Activation maps of the control subjects are collapsed and displayed by the black contours. Activation of the individual DPs is plotted in color. Right: beta-values by condition, group and DP. Error bars represent one standard error of the mean (SEM). Conditions represent from left to right: fearful faces, happy faces, neutral faces, fearful bodies, happy bodies, neutral bodies and houses. White columns display the average value of the three patients. Black columns show the average value of the controls. Triangles represent the individual values of the DPs.

