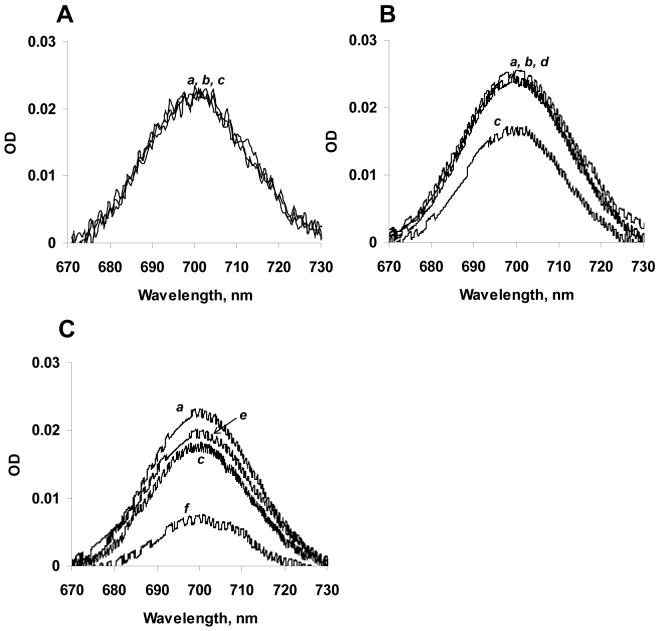
Figure 3. Optical spectra of CL/cyt c complexes corresponding to absorbance of Fe-S(Met80) bond.
Adjusted 695 nm spectra of CL/cyt c complexes in 50 mM phosphate buffer (A) and 25 mM HEPES buffer (B, C): (a) cyt c, (b) DOPC liposomes with cyt c after 15 min incubation, (c) TOCL/DOPC liposomes with cyt c after 15 min incubation, (d) TOCL/DOPC with cyt c after 15 min incubation in high-ionic buffer (25 mM HEPES plus 1 M KCl), (e) cyt c incubated with KCN for 15 min, (f) TOCL/DOPC liposomes with cyt c and KCN after 15 min incubation. Liposomes 1 mM total lipids, cyt c 50 μM, KCN 500 μM.

