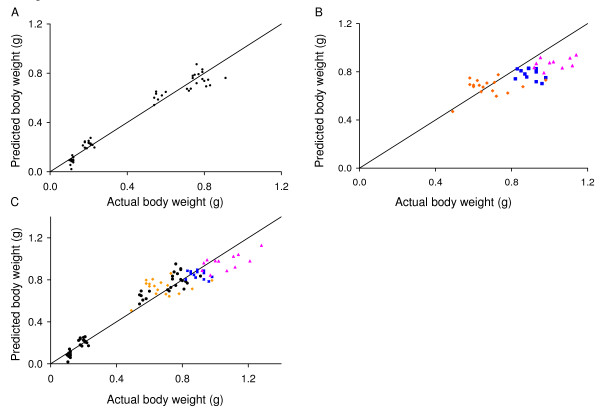
Figure 9.
Correspondence between predicted and measured embryonic body weight. (A) Embryo weight predicted using the multiple regression equation based on ultrasound measurement of crown-rump length and abdominal circumference in CD-1 mice versus measured body weight for each CD-1 embryo. (B) Equation derived from data obtained in CD-1 mice applied to three other strains of mice (C57Bl/6J (dark blue squares), B6CBAF1 (pink triangles), and hIGFBP1 transgenics (orange diamonds)). (C) Equation derived using data from all four strains is shown applied to all four strains (CD-1 (black circles), C57Bl/6J (dark blue squares), B6CBAF1 (pink triangles), and hIGFBP1 transgenics (orange diamonds)). Each point shows the result obtained in one conceptus. The lines show the line of identity (where y = x).

