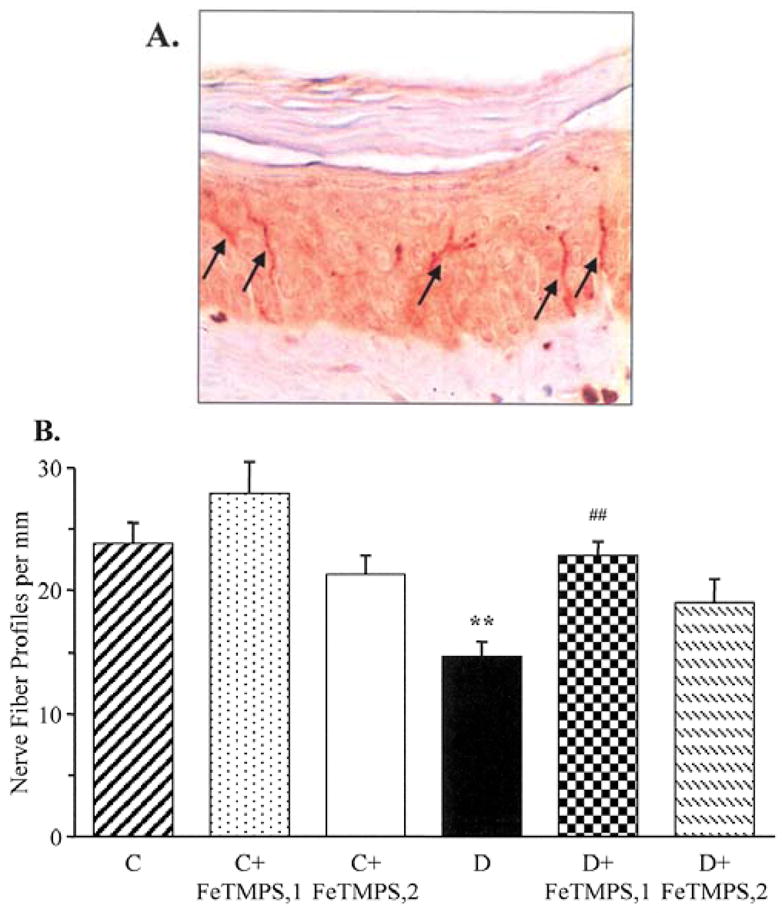
Figure 4.

Intraepidermal nerve fiber profiles in the control and diabetic mice with and without the peroxynitrite decomposition catalyst FeTMPS treatment. (A) Representative image of intraepidermal nerve fiber profiles, magnification ×200; and (B) skin fiber density. Mean ± SEM, n=8–14 per group. C, control mice; D, diabetic mice. FeTMPS,1 and FeTMPS,2 administered at 5 and 10 mg kg−1 day−1, respectively. **p<0.01 vs the control mice; ##p<0.01 vs untreated diabetic mice.
