
Figure 7.
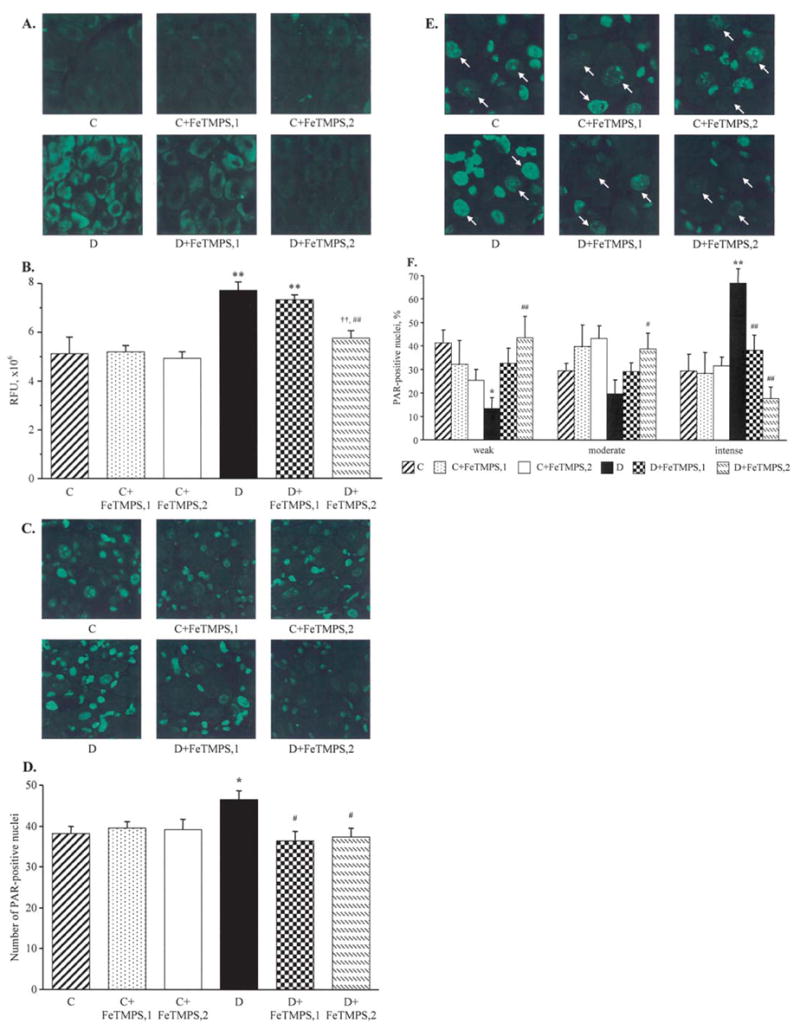
Representative microphotographs of immunofluorescent staining of nitrotyrosine (A) and poly(ADP-ribose) (C) in the dorsal root ganglia, and poly(ADP-ribose) in the dorsal root ganglion neurons (E) of the control and diabetic mice with and without the peroxynitrite decomposition catalyst FeTMPS treatment. Magnification, ×40. Scores of nitrotyrosine immunofluorescence in the dorsal root ganglion neurons (B), counts of dorsal root ganglion poly(ADP-ribose)-positive nuclei (D), and percentage of dorsal root ganglion neurons with weak, moderate, and intense poly(ADP-ribose) immunofluorescence (F), in the experimental groups. The number of dorsal root ganglion neurons with weak, moderate and intense poly(ADP-ribose) immunofluorescence was expressed as the percentage of neurons with identifiable poly(ADP-ribose) immunofluorescence in the dorsal root ganglia of the control and diabetic mice with and without the peroxynitrite decomposition catalyst FeTMPS treatment. Mean ± SEM, n=8–12 per group. C, control mice; D, diabetic mice. FeTMPS,1 and FeTMPS,2 administered at 5 and 10/mg/kg/day, respectively. *p<0.05 and **p<0.01 vs the non-diabetic control mice; #p<0.05 and ##p<0.01 vs untreated diabetic mice.