
Figure 2.
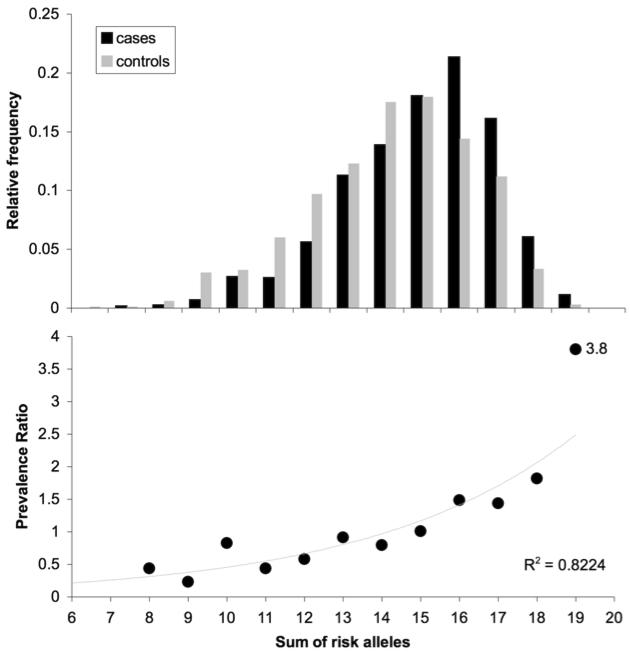
Distribution of risk alleles among cases and controls in the combined sample (a), and relationship of prevalence ratio to risk allele burden (b). Data from ten individually genotyped SNPs (rs4411993, rs7683874, rs10937823, rs942518, rs11021955, rs10120953, rs1170191, rs9315885, rs9513877, rs2360111) are plotted. Cases are indicated in black, controls in gray. An exponential function provides a good fit to the data (R2 = 0.82).