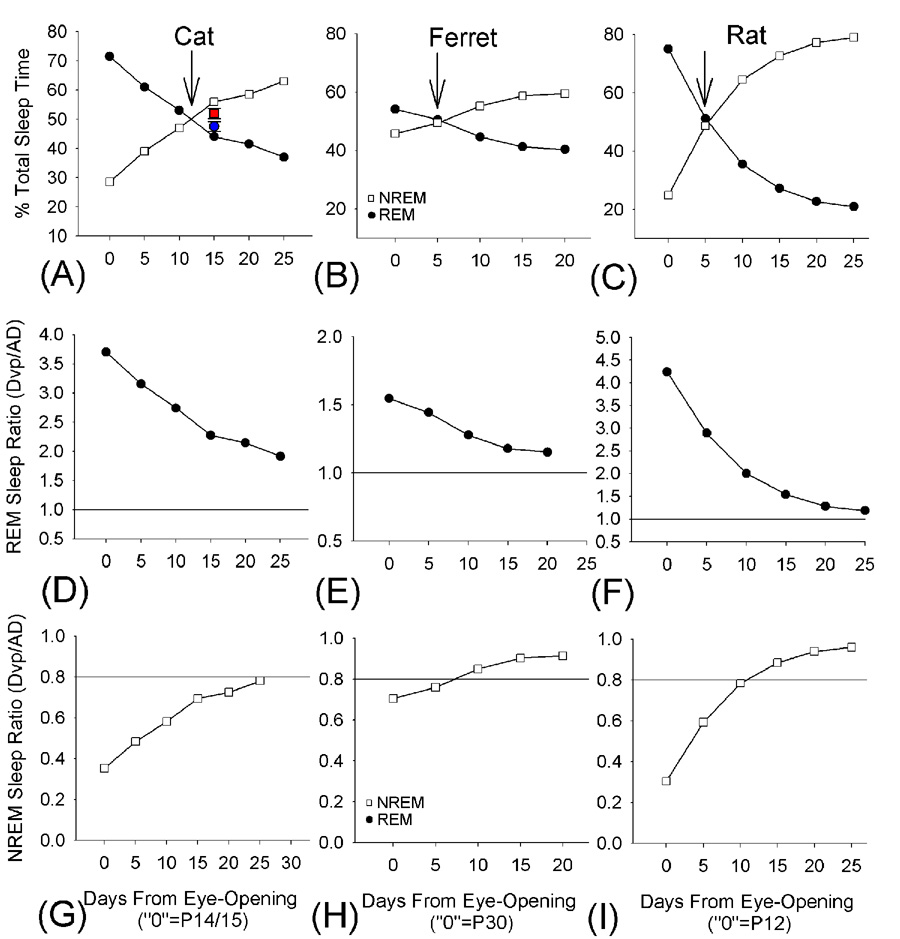
Figure 10. Cross-species comparisons of sleep ontogenesis: sleep time analyses.
Panels A–C show REM and NREM sleep amounts as a % total sleep time in the cat, ferret and rat vs. time in days from species-specific eye-opening. The age near eye-opening is set at “0”, and data extrapolated from previous studies in the cat [8,29,39,49] and rat [18] and ferret (present study) are shown in approximately 5 day intervals. The actual postnatal age at time “0” is shown in parentheses in the X axis for each species. The inset values in (A) are mean ± SEM data from P30–32 cats in the present study. The arrows indicate the ‘crossing’ point where NREM sleep begins to equal REM sleep in amounts. Panels D–F and G–H show REM sleep and NREM the ratio of postnatal sleep amounts to corresponding adult values (extrapolated from previous studies in the cat [35,54–56], ferret [26] and rat [3,4]. The reference line in D–F indicates 100% of adult values. The reference line in G–I indicates the time at which approximately 80% of the adult value is reached.

