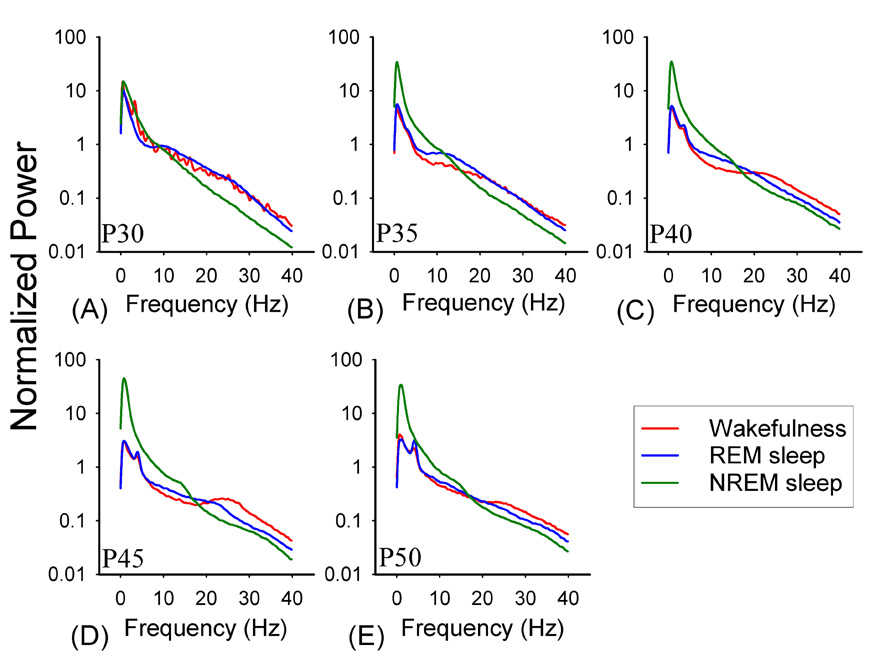
Figure 2. EEG spectral profiles of vigilance state EEGs.
Data are mean (normalized) Fourier transformed EEGs from REM sleep, NREM sleep and wakefulness (P30–P45 n=8, P50 n=6, P55 n=4). Note that NREM slow-wave activity increases sharply between P30 (A) and P35 (B) and that a peak in the theta frequencies is first evident at P40 (C).

