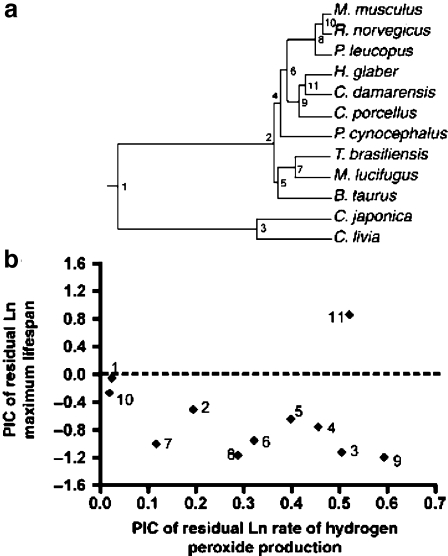
Fig. 3.
Comparative analysis of ln maximum lifespan vs residual ln rate of mitochondrial H2O2 production during succinate respiration using phylogenetic independent contrasts (PIC). a Construction of a phylogenetic “tree” for 12 mammalian and avian species results in 11 contrasts (nodes numbered 1–11) based on phylogenetic distance. The plot in b represents the PIC of residual ln maximum lifespan (corrected for body mass) vs PIC of residual ln H2O2 production rate (corrected for body mass) with the x-axis ‘positivized’ (Garland et al. 1992). For 10 of the 11 points in b, H2O2 production is negatively correlated with maximum lifespan, emphasized by the fact that 10 of the 11 points fall below the dashed line at y = 0. This relationship achieves significance in a sign test (P = 0.011; sign test), but not in a regression analysis due to the outlier at node 11 representing the contrast between two mole-rat species. Reprinted with permission from Lambert et al. 2007

