Fig. 2.
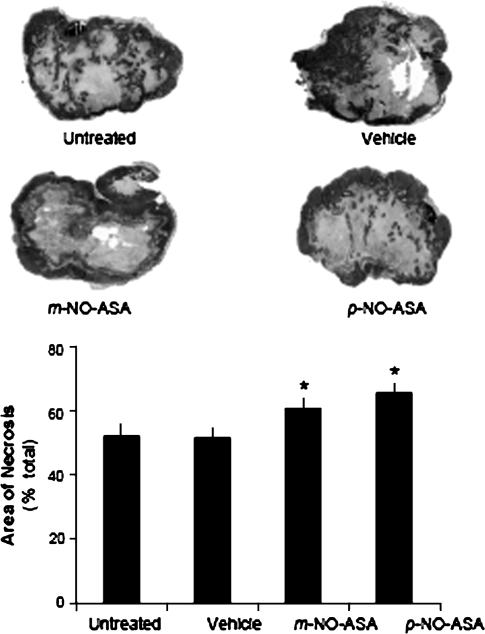
NO-ASA induces necrosis in HT-29 xenografts. Representative micrographs of tumors form the four study groups. There were 12 mice per group, except for the untreated group (n = 8). Tissues, processed as described in Materials and Methods, were stained with hematoxylin and eosin and the area of necrosis was measured. *Statistically significant difference compared with the vehicle control group. The histogram shows the mean ± SEM of the necrotic area expressed as percentage of the total tumor section surface area. Magnification ×5.

