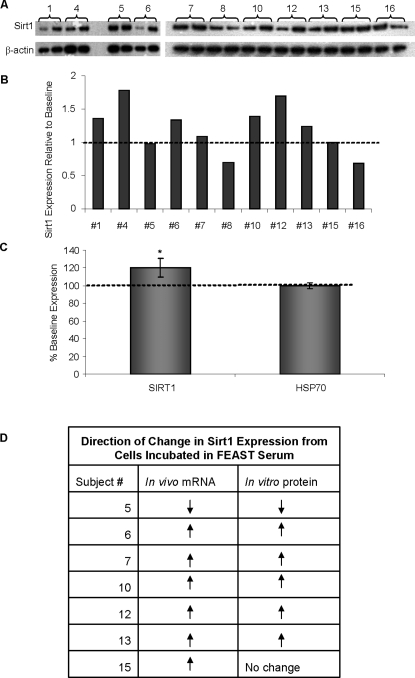
Figure 3. Increased Sirt1 protein levels in cells incubated in FEAST sera.
Sirt1 expression was evaluated using western blotting techniques. (A) The first and second band of each pair of bands under the subject # represents relative levels of Sirt1 protein induced by baseline and day 21 sera samples respectively. (B) shows relative values of levels induced in cells cultured in day 21 sera with respect to cells cultured in baseline sera. (C) Cumulative average change in Sirt1 and HSP70 levels induced by day 21 sera with respect to baseline sera. *p<.0005 (D) shows the directional change in Sirt1 mRNA levels in muscle biopsies from baseline to 3 weeks matched exactly in 6 out of 7 participants whose serum was used for Sirt1 protein in vitro analysis.

