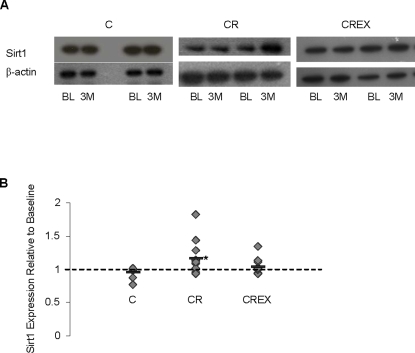
Figure 5. Increased Sirt1 protein levels in cells incubated in CR sera.
Sirt1 expression was evaluated using western blotting techniques. (A) Shows representative blots of Sirt1 and β-actin protein. The first and second bands of each pair of bands represent relative levels of Sirt1 protein induced in HepG2 cells by baseline (BL) and 3 month (3 M) sera samples, respectively. (B) Shows changes in sirt1 levels relative to baseline. For C, CR and CREX n = 9, 11 and 11 respectively. * p = 0.018.

