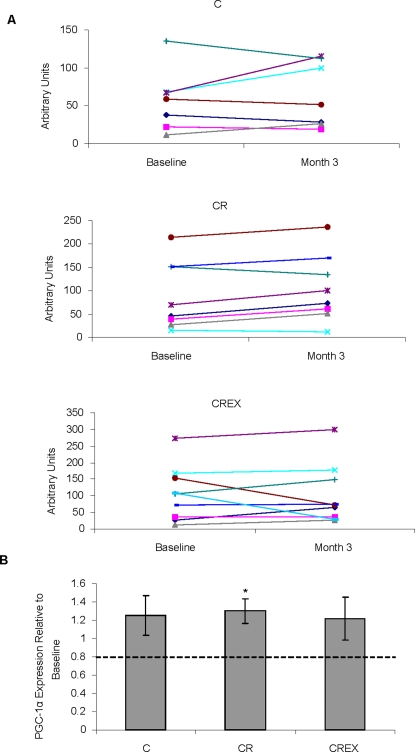
Figure 6. Changes in PGC-1α mRNA expression in cells cultured with sera from CALERIE Participants.
HepG2 cells were cultured in media supplemented with human sera for 48 h (A) shows relative changes in PGC-1α mRNA in cells cultured with serum collected after 3 months on diets compared to cells cultured with serum collected at baseline. (B) Shows the average relative change in PGC-1α mRNA expression for each diet group. For C, CR and CREX n = 7, 8 and 9, respectively. * p = 0.032.

