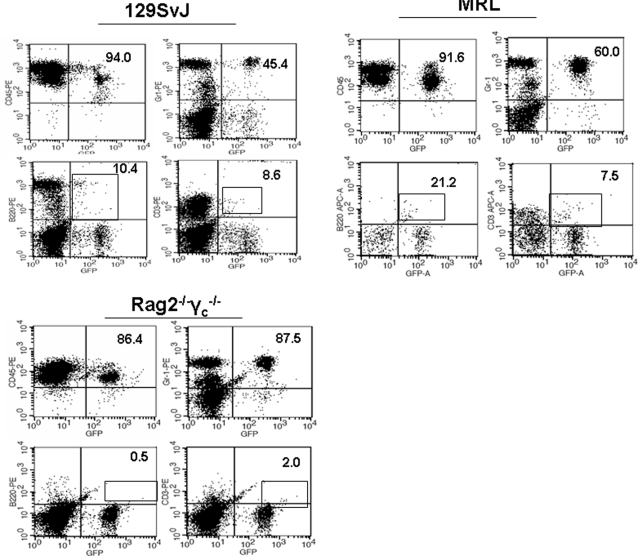
Figure 3. Poor T and B cell development in HPC-derived hematopoietic cells.
Using flow cytometry, chimeric 129SvJ, MRL, and Rag2−/−γc −/− mice were analyzed for donor cells at 28 days post-transplantation. In all three strains, Gr-1+ cells were the predominant sub-population with lower cell numbers of B220- and CD3-expressing B and T cells, respectively. The percentages are calculated within the GFP+ population.

