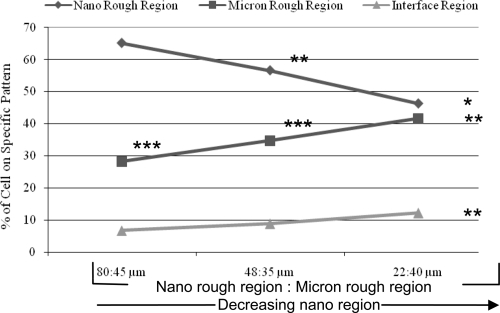
Figure 6.
Greater osteoblast adhesion on the Ti nano rough region regardless of pattern width after four hours.
Notes: Data are mean ± SEM; n = 3; *p < 0.01 and **p < 0.05 compared with the 80:45 μm grid pattern on the respective regions; ***p < 0.01 compared with the nano region on the respective samples. Indicated on this graph are the percent of cells adhering to the specific pattern of each substrate. This data was collected from the same experiments as those completed in Figure 5.

