
Figure 2. Relationships between referee gender and manuscript handling.
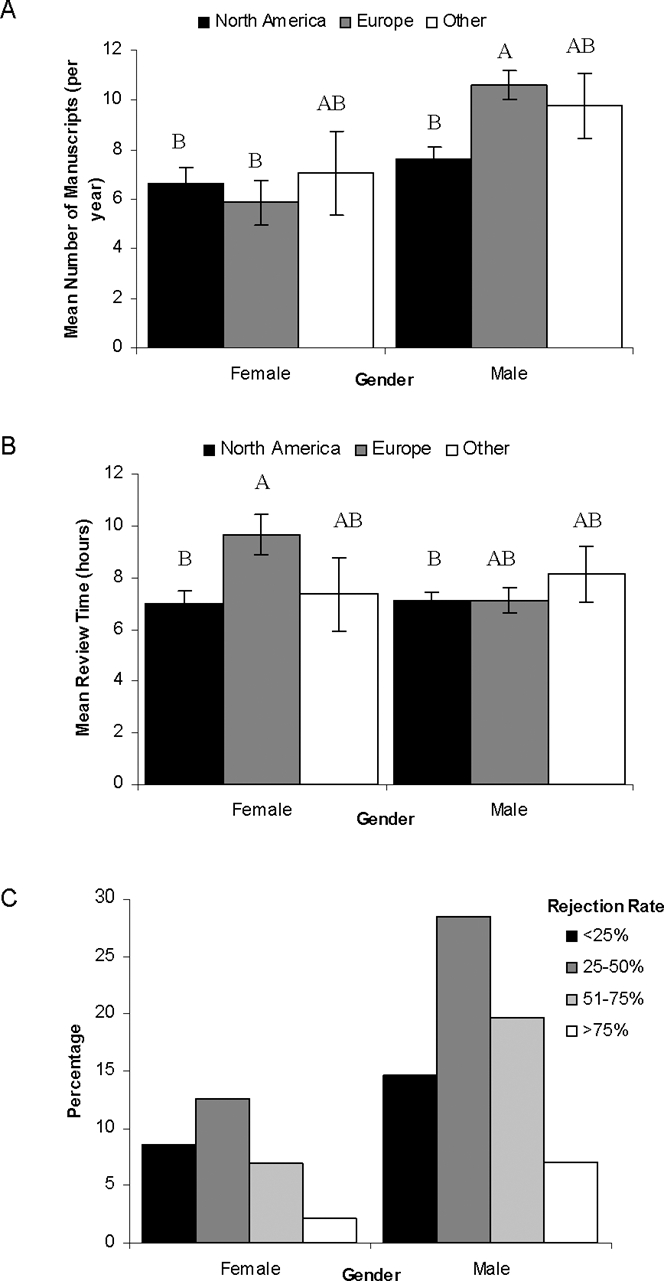
Panel 2a shows the number of manuscripts reviewed per year, and 2b displays the time it takes to review a manuscript in hours. Data are presented as mean ±SE. Gender and regions not connected by the same letter are significantly different (Tukey HSD, p<0.05). Panel 2c highlights the rejection frequency among females and males.