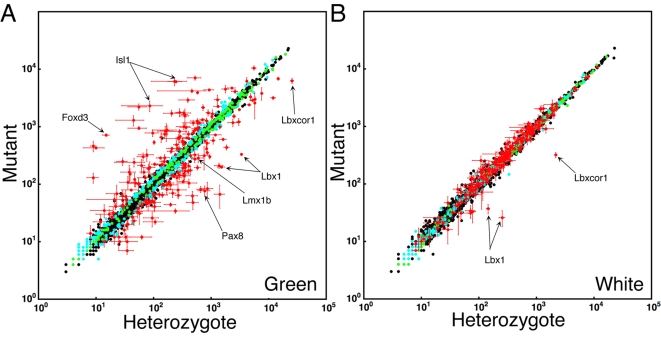
Figure 2. Identification of Lbx1-dependent SSTF Targets.
Comparisons were between heterozygotes (x-axis) and mutants (y-axis) in green (left panel) and white (right panel) cell pools. The average intensity values from three independent arrays of three independent isolates are shown. Values for 3574 probe sets corresponding to 1691 SSTF genes are plotted. All 12 arrays were normalized using GCRMA. Color coding, given to each probe set based on their behavior in the green comparison, was maintained in the white comparison. Colored dots represent probe sets that change in a uniform direction in all of the 9 possible 2-way comparisons between the three mutant and three heterozygous arrays of green cells. Probe sets are color coded to show those that passed the 1.3 fold threshold in 35–84 (red), 1–34 (cyan), or zero (green ) permutations of three pair wise, logical AND, comparisons in green cells. Red probe sets were selected to create the tables. Note that red probe sets change in the green comparison but not in the white comparison. The positive controls Lbx1, Lmx1b, Isl1, and Foxd3 are indicated. No probe sets exists for Pax2. However, both Pax8 and Pax5 are regulated in the direction predicted for Pax2.

