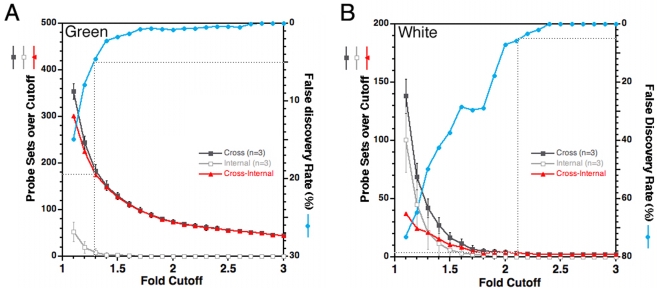
Figure 3. Limiting the Total Target Number by FDR.
A) Array data from GFP expressing cells of neural tubes (Green) was compared. These are cells that normally express Lbx1. B) Array data from neural tube cells lacking GFP (White) was compared. These are cells that normally lack Lbx1. In each panel, the results from individual arrays was compared, in a pair-wise manner, between replicate arrays of the same condition (internal), and between arrays of mutant and heterozygote conditions (cross). Triplicate array measurements allowed three pair wise internal-comparisons to be made for each of the four conditions (hG, mG, hW, mW) and nine pair wise cross-comparisons to be made between mutant and heterozygote conditions. The number of probe sets with fold changes at or above a given fold cutoff in three specific internal-comparisons was measured and represents the number of false positives because the comparison was between biological replicates (open squares). The numbers of probe sets with fold changes at or above a given fold cutoff for three specific cross-comparisons between heterozygous and mutant arrays was measured in a comparable manner. Each of the 84 possible permutations of three specific cross-comparisons (of the nine available cross-comparisons) was evaluated at each fold cutoff. The average value obtained from all 84 permutations (filled squares) was plotted in each panel and represents the total number of positives, true plus false. By this method, the number of probe sets above a given fold cutoff was determined in an equivalent manner in cross- and internal-comparisons. The FDR (blue circles) was calculated by dividing the false positives by the total positives. The number of true positives (triangles) was calculated at each fold cutoff by subtracting the false positives from the total positives (see Materials and Methods for a more detailed description of the analysis) .

