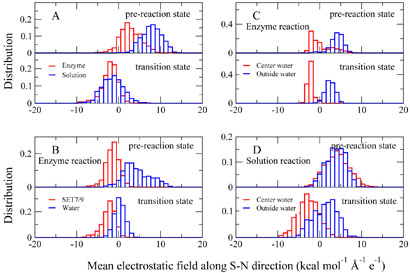
Figure 5.
The normalized distribution of the calculated mean electrostatic field along the Sδ – Nζ direction in the pre-reaction states (Rc = −1:75Å) and transition states. (A): The total contribution of the enzyme environment (including SET7/9 and all water molecules in the enzyme simulation system, colored in red) and the solvent environment (including all water molecules in the aqueous solution simulation system, colored in blue) to the MEF-SN in reactants and transition states. (B): For the enzyme reaction, the specific contribution of the SET7/9 (colored in red) and water molecules (colored in blue) to the MEF-SN in the reactant and in the transition state. (C): For the enzyme reaction, the specific contribution of water molecules near the active site (less than 4 Å away from either of the Sδ, Cϵ and Nζ atoms, colored in red) and the rest outside water molecules (colored in blue) to MEF-SN in the reactant and in the transition state. (D): For the aqueous solution reaction, similar to (C), the specific contribution of water molecules near the active site (less than 4 Å away from either of the Sδ, Cϵ and Nζ atoms, colored in red) and the rest outside water molecules (colored in blue) to MEF-SN in the reactant and in the transition state.

