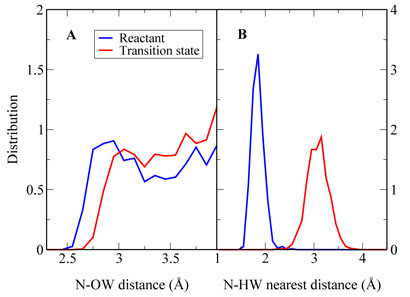
Figure 7.
Illustration of the solvation environment difierence between the pre-reaction state (Rc = −1:75Å) and the transition state for the uncatalyzed reaction in aqueous solution. (A) Normalized distribution of water molecules (oxygen atom) near the Nζ atom of the histone lysine residue. (B) Normalized distribution of the closest hydrogen atom of water molecules near the Nζ atom of the histone lysine residue.

