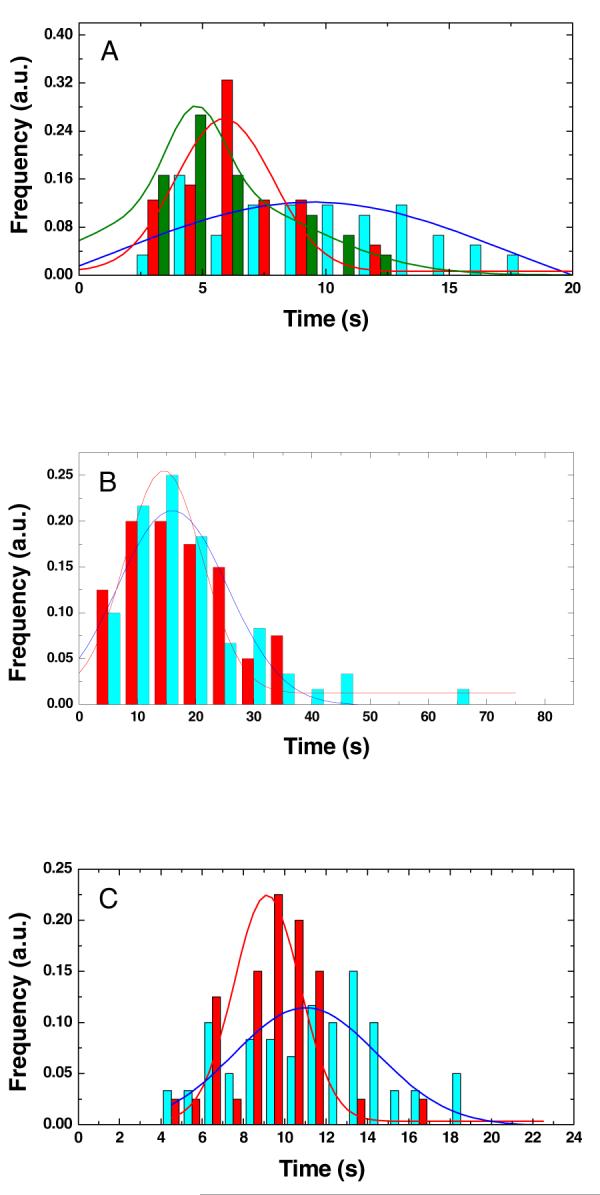
FIGURE 3.

Time lapses with their Gaussian fitting curves for (A) association, (B) recognition, and (C) dissociation by endo V, activated by Ca2+ (case 1, green), Mg2+ (case 2, red), and Ca2+-Mg2+ (case 3, blue), respectively. The vertical axes are normalized in each case. The fitted time lapses T1 for the association events in (A) are 4.9±1.8 s, 5.9±2.0 s, and 9.5±7.9 s for cases 1, 2, and 3. The fitted time lapses T2 for the recognition events in (B) are 14.5±6.6 s and 16.0±9.5 s for cases 2 and 3. The fitted time lapses T3 for the dissociation events in (C) are 9.1±1.6 s and 11.0±3.4 s for cases 2 and 3.
