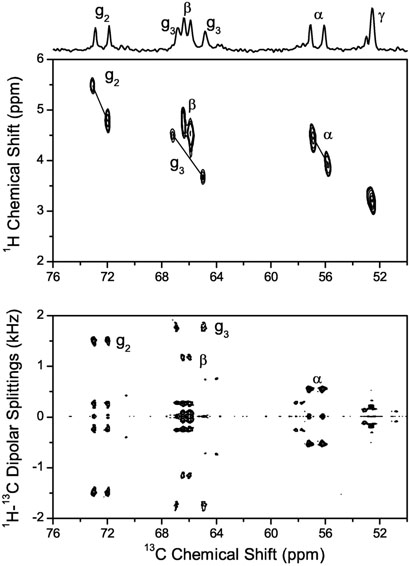
Fig. 6.
Contour plot of the headgroup and glycerol region of the 2D 13C-1H correlation spectrum (top). The tilted dipolar doublets are indicated by solid lines. The doublets are due to 13C-31P and 1H-31P dipolar interactions resulting in splittings of the 13C-1H cross peaks along the horizontal axis and vertical axis, respectively. The experimental conditions are as mentioned for the PDLF spectrum in Fig. 3. Comparison to the 13C-1H PDLF spectrum (bottom) was used to assign the peaks.

