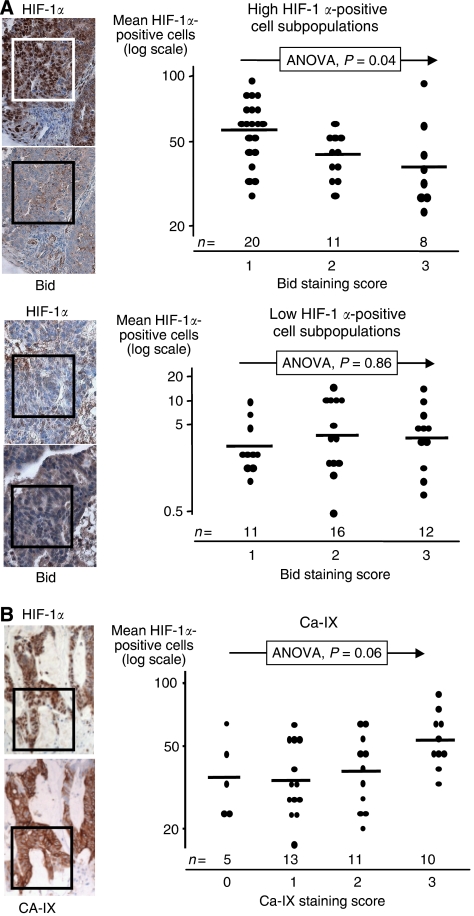
Figure 2.
(A) Hypoxia inducible factor-1α-positive nuclei scores vs Bid category scores in the paired same area serial analysis. Upper panel represents high mean HIF-1α scores (greater than 20 positive nuclei per area). Lower panel represents low mean HIF-1α scores. Boxes represent 200 × 200 μm2. Geometric means (horizontal lines) are compared across the categories using an ANOVA model. Y axis is log-transformed. n indicates number of tumours per Bid category score. (B) Similar graphic representation of HIF-1α-positive nuclei scores vs CA-IX expression.

