Figure 3.
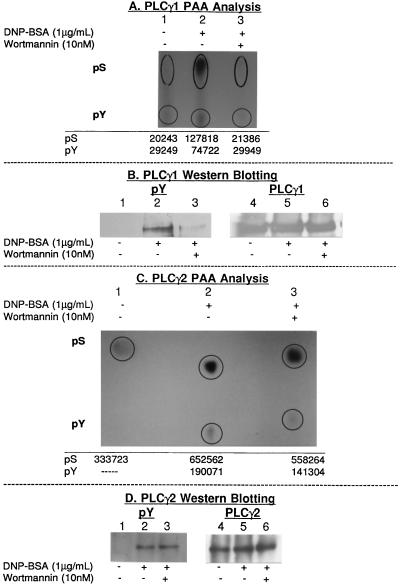
Phosphoamino acid analysis of PLCγ isoforms. Phosphate-labeled bands corresponding to PLCγ1 and PLCγ2 were excised from PVDF membranes after transfer from SDS-PAGE. Each band was digested to constituent amino acids and the entire sample was used for one-dimensional TLC analysis as described in MATERIALS AND METHODS. Mobilities of phosphoserine and phosphotyrosine were determined on the basis of authentic standards; neither isoform had detectable levels of phosphothreonine. The numbers under each lane represent the relative PhosphorImager units corresponding to phosphoserine and phosphotyrosine, adjusted for background. A) Phosphoamino acid content of PLCγ1 in resting cells (lane 1), after 2 min (lane 2) of cross-linking FcεRI with antigen and after 10 nM wortmannin treatment followed by 2 min with antigen (lane 3). B+D). Western blot analysis of PLCγ1(B) or PLCγ2(D) immunoprecipitated from resting and 2 min antigen-activated cells (with and without wortmannin pretreatment) probed with anti-pY (B+D; lanes 1–3), stripped and reprobed with anti-PLCγ1 antibodies (B; lanes 4–6) or anti-PLCγ2 (D; lanes 4–6). C) Phosphoamino acid content of PLCγ2 in resting cells (lane 4), in control cells after 2 min of antigen (lane 5) or in 10 nM wortmannin-treated cells after 2 min of antigen (lane 6).

