Figure 5.
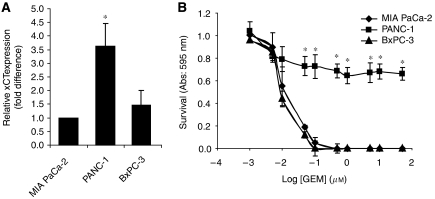
A positive correlation exists between the expression level of xCT and resistance towards GEM. (A) Q-RT–PCR for xCT expression in MIA PaCa-2, PANC-1, and BxPC-3 cell lines. Data represent the mean±s.e.m. from three independent experiments. *P<0.05. (B) Neutral red uptake assay for cell proliferation in Mia PaCa-2, PANC-1, and BxPC-3 cultures treated with increasing concentrations of GEM for 72 h. Data represent the mean±s.e.m. from three independent experiments. *P<0.01.

