Figure 5.
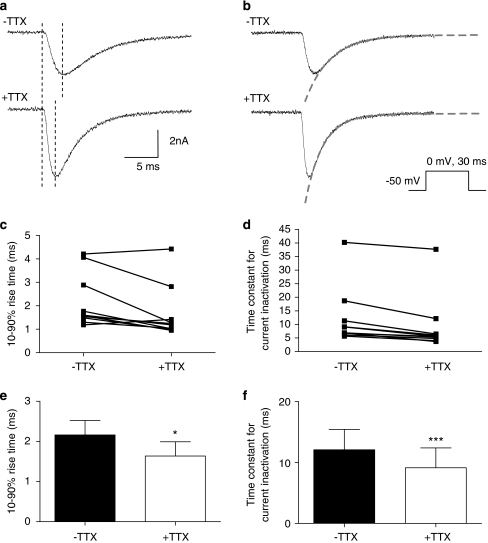
Effect of TTX on TTXR current kinetics. (a and b) The traces show examples of isolated TTXR current before (top trace) and after (bottom trace) application of TTX. The protocol used is shown. (a) Example of cursor placements (dashed lines) between which the 10–90% rise time of the current was measured to study the rate of current activation is shown. The dashed lines in panel b show how the exponential curves were fitted to study current inactivation rate. The fitted curve equations provide time constant measurements for the rate of inactivation. (c and d) The plots show individual cell data demonstrating how the 10–90% rise time (c) and rate of inactivation (d) are altered following the addition of 0.5 μM TTX. The averages and statistical comparisons of these data are shown in (e) and (f). (e) The average 10–90% rise time for TTXR current activation is reduced by the addition of 0.5 μM TTX, suggesting that the currents are activating faster (*P<0.05, paired Student's t-test). (f) The average time constant for TTXR current inactivation is significantly decreased in the presence of 0.5 μM TTX, suggesting that current inactivation is also faster (***P<0.001 paired Student's t-test). All data shown in panels c to f come from the same set of cells (n=10).

